| ||
|
| ||
| Elections in Georgia |
|---|
 |
In the 2006 Georgia elections, Incumbent Governor Sonny Perdue, the first Republican Governor of Georgia since reconstruction, was re-elected over then-Lieutenant Governor Mark Taylor (D).
Prior to the elections, though Republicans held the Governor's mansion and majorities in both houses of the Georgia General Assembly, Democrats then-held five of the eight statewide offices. Following the elections, Republicans would pick up two positions, those being Lieutenant Governor and Secretary of State, with the victories of Casey Cagle (who became the eleventh overall and first ever Republican elected Lieutenant Governor) and Karen Handel (who became the twenty-sixth overall and first Republican since reconstruction to be Secretary of State) in each of their respective races. Both positions were open after the incumbent office holders chose to seek the governorship of Georgia.
All other state Executive Officers, Attorney General of Georgia Thurbert Baker (D), state Superintendent of Schools Kathy Cox (R), Commissioner of Insurance John Oxendine (R), Commissioner of Agriculture Tommy Irvin (D), and Commissioner of Labor Mike Thurmond (D), were re-elected. This was the last time Democrats won a statewide election in Georgia until 2020 when Democrat Joe Biden won the state in the presidential election as well as the last time Democrats won statewide office in Georgia until Jon Ossoff and Raphael Warnock were elected to the Senate in 2021.
Federal elections
United States Congressional elections
In 2006, all thirteen of Georgia's U.S. House seats were up for election. Neither of the Peach state's U.S. Senate seats were up for election that year.
United States House of Representatives elections
All thirteen of Georgia's incumbent Representatives sought re-election in 2006. Going into the elections, Republicans held seven of Georgia's U.S. House seats and Democrats held six seats.
Despite significant gains by Republicans in Georgia since 2002, such as consecutive Republican victories since in Presidential elections since 1996, gaining both of Georgia's U.S. Senate seats, the election of Sonny Perdue as Georgia's first post-Reconstruction Republican governor in 2002, successful elections of Republicans to other state executive offices, and gaining control of both chambers of the Georgia General Assembly for the first time since Reconstruction, Democrats have succeeded in gaining seats of Georgia's House delegation in recent House elections.
Following gains in both houses of the General Assembly in 2002 and 2004, Republicans enacted a mid-decade redistricting to alter the congressional districts created by the 146th Georgia General Assembly, which Democrats held control of at the time, with the intention of benefiting Republicans. Two Democratic incumbents who were especially targeted were Jim Marshall (GA-8) and John Barrow (GA-12). They were opposed respectively by former Representatives Mac Collins (who previously represented what is now the Third district) and Max Burns. These two races were among the most competitive in the nation, but ultimately resulted in both incumbents being re-elected by razor thin margins of 1 and 0.6 percentage points respectively.
The partisan makeup of Georgia's House delegation did not change, however one Incumbent, Cynthia McKinney (GA-4), was denied renomination by her 59% to 41% defeat in the Democratic Primary runoff to then-Dekalb county Commissioner Hank Johnson.
Governor
In the Republican primary, incumbent Sonny Perdue defeated challenger Ray McBerry by a margin of 88 percent to 12 percent. In the Democratic primary, Lieutenant Governor Mark Taylor defeated state Secretary of State Cathy Cox, Bill Bolton, and Mac McCarley with 51.7 percent of the vote to Cox's 44 percent, Bolton's 2 percent, and McCarley 2 percent. Libertarian Garrett Michael Hayes faced Perdue Mark Taylor in the general election. Independent John Dashler withdrew from the race, unable to collect the 40,000 signatures required for ballot access.
Perdue was re-elected to a second term, winning 57.9 percent of the vote.
Lieutenant governor
| |||||||||||||||||
| |||||||||||||||||
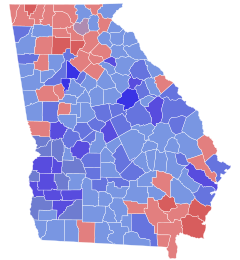
 County results Cagle: 40-50% 50-60% 60-70% 70-80% Martin: 40-50% 50-60% 60-70% 70-80% | |||||||||||||||||
| |||||||||||||||||
General election results
| Party | Candidate | Votes | % | |
|---|---|---|---|---|
| Republican | Casey Cagle | 1,134,517 | 54.1 | |
| Democratic | Jim Martin | 887,506 | 42.3 | |
| Libertarian | Allen Buckley | 75,673 | 3.6 | |
Primary Results
Democrats
| Candidate | Votes | % | |
|---|---|---|---|
| Jim Martin | 184,635 | 41.2 | |
| Greg Hecht | 163,004 | 36.4 | |
| Steen Miles | 64,714 | 14.4 | |
| Griffin Lotson | 22,378 | 5.0 | |
| Rufus Terrill | 13,375 | 3.0 | |
| Candidate | Votes | % | |
|---|---|---|---|
| Jim Martin | 141,927 | 62.4 | |
| Greg Hecht | 85,399 | 37.6 | |
Republicans
| Candidate | Votes | % | |
|---|---|---|---|
| Casey Cagle | 227,968 | 56 | |
| Ralph Reed | 178,790 | 44 | |
Libertarian
- Allen Buckley
Secretary of State
| |||||||||||||||||
| |||||||||||||||||
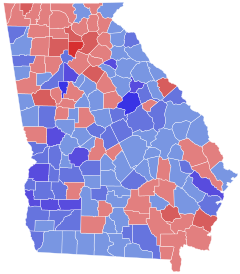
 County results Handel: 40-50% 50-60% 60-70% 70-80% Buckner: 40-50% 50-60% 60-70% 70-80% | |||||||||||||||||
| |||||||||||||||||
General Election Results
| Party | Candidate | Votes | % | |
|---|---|---|---|---|
| Republican | Karen Handel | 1,116,216 | 54.1 | |
| Democratic | Gail Buckner | 862,412 | 41.8 | |
| Libertarian | Kevin Madsen | 84,670 | 4.1 | |
Primary Results
Democrats
| Candidate | Votes | % | |
|---|---|---|---|
| Gail Buckner | 107,554 | 25.4 | |
| Darryl Hicks | 92,742 | 21.9 | |
| Angela Moore | 74,218 | 17.5 | |
| Shyam Reddy | 69,802 | 16.5 | |
| Scott Holcomb | 48,738 | 11.5 | |
| Walter Ray | 29,992 | 7.1 | |
| Candidate | Votes | % | |
|---|---|---|---|
| Gail Buckner | 119,238 | 55.1 | |
| Darryl Hicks | 97,061 | 44.9 | |
Republicans
| Candidate | Votes | % | |
|---|---|---|---|
| Karen Handel | 160,542 | 43.6 | |
| Bill Stephens | 120,173 | 32.6 | |
| Charlie Bailey | 50,792 | 13.8 | |
| Eric Martin | 36,932 | 10 | |
| Candidate | Votes | % | |
|---|---|---|---|
| Karen Handel | 96,931 | 56.6 | |
| Bill Stephens | 74,198 | 43.4 | |
Libertarian
- Kevin Madsen
Attorney general
| |||||||||||||||||
| |||||||||||||||||
 County results Baker: 50–60% 60–70% 70–80% 80–90% McGuire: 50–60% 60–70% Tie: 50% | |||||||||||||||||
| |||||||||||||||||
General Election Results
| Party | Candidate | Votes | % | |
|---|---|---|---|---|
| Democratic | Thurbert Baker (incumbent) | 1,185,366 | 57.2 | |
| Republican | Perry McGuire | 888,288 | 42.8 | |
State School Superintendent
| |||||||||||||||||
| |||||||||||||||||
 County results Cox: 40-50% 50-60% 60-70% 70-80% 80-90% Majette: 40-50% 50-60% 60-70% | |||||||||||||||||
| |||||||||||||||||
General election results
| Party | Candidate | Votes | % | |
|---|---|---|---|---|
| Republican | Kathy Cox | 1,257,236 | 54.2 | |
| Democratic | Denise Majette | 734,702 | 43.0 | |
| Libertarian | David Chastain | 106,215 | 2.8 | |
Primary election results
Democrats
| Candidate | Votes | % | |
|---|---|---|---|
| Denise Majette | 288,564 | 67.1 | |
| Carlotta Harrell | 141,630 | 32.9 | |
Republicans
| Candidate | Votes | % | |
|---|---|---|---|
| Kathy Cox | 259,711 | 64.7 | |
| Danny Carter | 141,582 | 35.3 | |
Libertarian
- David Chastain
Commissioner of Insurance
| |||||||||||||||||
| |||||||||||||||||
Oxendine: 50–60% 60–70% 70–80% 80–90% 90% Drexinger: 50–60% 60–70% 70–80% 80–90% 90% | |||||||||||||||||
| |||||||||||||||||
General Election Results
As of 2023, this is the last time Fulton County, the state's largest county and home to Atlanta, voted Republican in a contested statewide election.
| Party | Candidate | Votes | % | |
|---|---|---|---|---|
| Republican | John Oxendine (incumbent) | 1,357,770 | 65.6 | |
| Democratic | Guy Drexinger | 713,324 | 34.4 | |
Commissioner of Agriculture
| |||||||||||||||||
| |||||||||||||||||
 County results Irvin: 40–50% 50–60% 60–70% 70–80% 80–90% Black: 40–50% 50–60% 60–70% | |||||||||||||||||
| |||||||||||||||||
General Election Results
| Party | Candidate | Votes | % | |
|---|---|---|---|---|
| Democratic | Tommy Irvin (incumbent) | 1,168,371 | 56.0 | |
| Republican | Gary Black | 846,395 | 40.6 | |
| Libertarian | Jack Cashin | 70,015 | 3.4 | |
Primary Results
Democrats
- Tommy Irvin (incumbent)
Republicans
| Candidate | Votes | % | |
|---|---|---|---|
| Gary Black | 153,568 | 42.3 | |
| Brian Kemp | 97,113 | 26.8 | |
| Bob Greer | 57,813 | 15.9 | |
| Deanna Strickland | 54,318 | 15.0 | |
| Candidate | Votes | % | |
|---|---|---|---|
| Gary Black | 101,274 | 60.0 | |
| Brian Kemp | 67,509 | 40.0 | |
Libertarian
- Jack Cashin
Commissioner of Labor
| |||||||||||||||||
| |||||||||||||||||
 County results Thurmond: 50-60% 60-70% 70-80% 80-90% Brown: 50-60% 60-70% 70-80% | |||||||||||||||||
| |||||||||||||||||
General election results
| Party | Candidate | Votes | % | |
|---|---|---|---|---|
| Democratic | Mike Thurmond (incumbent) | 1,127,182 | 54.8 | |
| Republican | Brent Brown | 929,812 | 45.2 | |
Primary election results
Democrats
- Michael Thurmond (incumbent)
Republicans
| Candidate | Votes | % | ± | |
|---|---|---|---|---|
| Brent Brown | 225,286 | 70.3 | ||
| Chuck Scheid | 94,998 | 29.7 | ||
Public Service Commission
District 3
This is a statewide race.
| ||||||||||||||||
| ||||||||||||||||
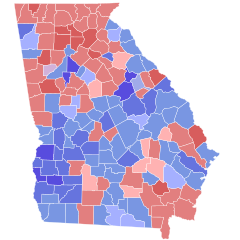
Eaton: 40–50% 50–60% 60–70% 70–80% 80–90% Burgess: 40–50% 50–60% 60–70% 70–80% 80–90% >90% Tie: 40–50% 50% | ||||||||||||||||
| ||||||||||||||||
General Election Results
| Party | Candidate | Votes | % | |
|---|---|---|---|---|
| Democratic | David L. Burgess | 994,619 | 48.8 | |
| Republican | Chuck Eaton | 941,748 | 46.3 | |
| Libertarian | Paul MacGregor | 99,747 | 4.9 | |
| Party | Candidate | Votes | % | |
|---|---|---|---|---|
| Republican | Chuck Eaton | 112,232 | 52.2 | |
| Democratic | David L. Burgess | 102,860 | 47.8 | |
Primary election results
Republicans
| Candidate | Votes | % | |
|---|---|---|---|
| Chuck Eaton | 182,469 | 58.6 | |
| Mark Parkman | 128,669 | 41.4 | |
Democrats
- David Burgess
Libertarians
- Paul MacGregor
District 5
This is a statewide race.
General Election Results
| Party | Candidate | Votes | % | |
|---|---|---|---|---|
| Republican | Stan Wise | 1,122,173 | 55.0 | |
| Democratic | Dawn Randolph | 823,681 | 40.4 | |
| Libertarian | Kevin Cherry | 95,247 | 4.7 | |
Primary Results
Republicans
| Candidate | Votes | % | |
|---|---|---|---|
| Stan Wise | 233,617 | 68.8 | |
| Newt Nickell | 105,929 | 31.2 | |
Democrats
- Dawn Randolph
Libertarians
- Kevin Cherry
General Assembly elections
Georgia Senate elections
Georgia House of Representatives elections
Judicial elections
In 2006, four seats on the Supreme Court of Georgia and four on the Georgia Court of Appeals were up for election. All judicial elections in Georgia are officially non-partisan.
Supreme Court of Georgia elections
Incumbent state Supreme Court Associate Justices George H. Carley, Harold Melton, Hugh P. Thompson, and Carol W. Hunstein were all re-elected with three being unopposed. Only Hunstein received any opposition, which she overcame handily.[1]
Supreme Court (Hunstein seat) election
| Party | Candidate | Votes | % | ±% | |
|---|---|---|---|---|---|
| Nonpartisan | Carol W. Hunstein | 1,170,973 | 63.1% | ||
| Nonpartisan | Mike Wiggins | 683,483 | 36.9% | ||
| Turnout | 1,854,456 | 100 | |||
Georgia Court of Appeals elections
Incumbent Judges John Ellington, M. Yvette Miller, Herbert E. Phipps, and J.D. Smith were re-elected without opposition.[2]
References
- ^ a b "Georgia election results 2006". Archived from the original on May 28, 2010. Retrieved March 15, 2010.
- ^ "Georgia election results 2006. Appeals". Archived from the original on May 28, 2010. Retrieved March 15, 2010.
External links
- Statewide qualifiers
- Primary Election Results Archived 2007-06-01 at the Wayback Machine
- Primary Runoff Results Archived 2006-12-14 at the Wayback Machine
- General Election Results


